






Separate automation from investment performance
An agent may reliably research, follow a schedule and place orders yet still lose money. Whether automation works operationally and whether a strategy earns a worthwhile return are separate questions.
A profitable screenshot cannot settle the second question. You need the complete period, cash flows, costs and risk taken, including unsuccessful agents that were later deleted or abandoned.
Start with the money in and out
Suppose an account starts at $1,000, receives a $500 deposit and ends at $1,530. The increase in balance is $530; only $30 is investment profit before any costs paid outside the account, assuming no other flows. The account did not earn 53%.
Calculating a percentage return also requires the deposit’s timing. Use a consistent cash-flow-aware method when comparing periods or strategies. Include dividends, fees and withdrawals. FINRA explains the underlying distinction in its guide to investment returns.
Keep a small scorecard
- Net return. Include model or platform costs even if you pay them from a different account.
- Benchmark. Choose one that fits the intended allocation and use the same dates and dividend treatment. A mostly-bond portfolio is not directly comparable with an all-stock index.
- Drawdown. Track the largest fall from a prior peak, adjusting for cash flows. A strong final balance can hide a painful path.
- Behavior. Count instruction violations, rejected or duplicated orders, turnover and unexplained changes.
Avoid rewriting the experiment
Write the plan, comparison method and review date before you start. Keep the losing periods. If you change a model or strategy, record when and why rather than presenting the combined history as one unchanged approach.
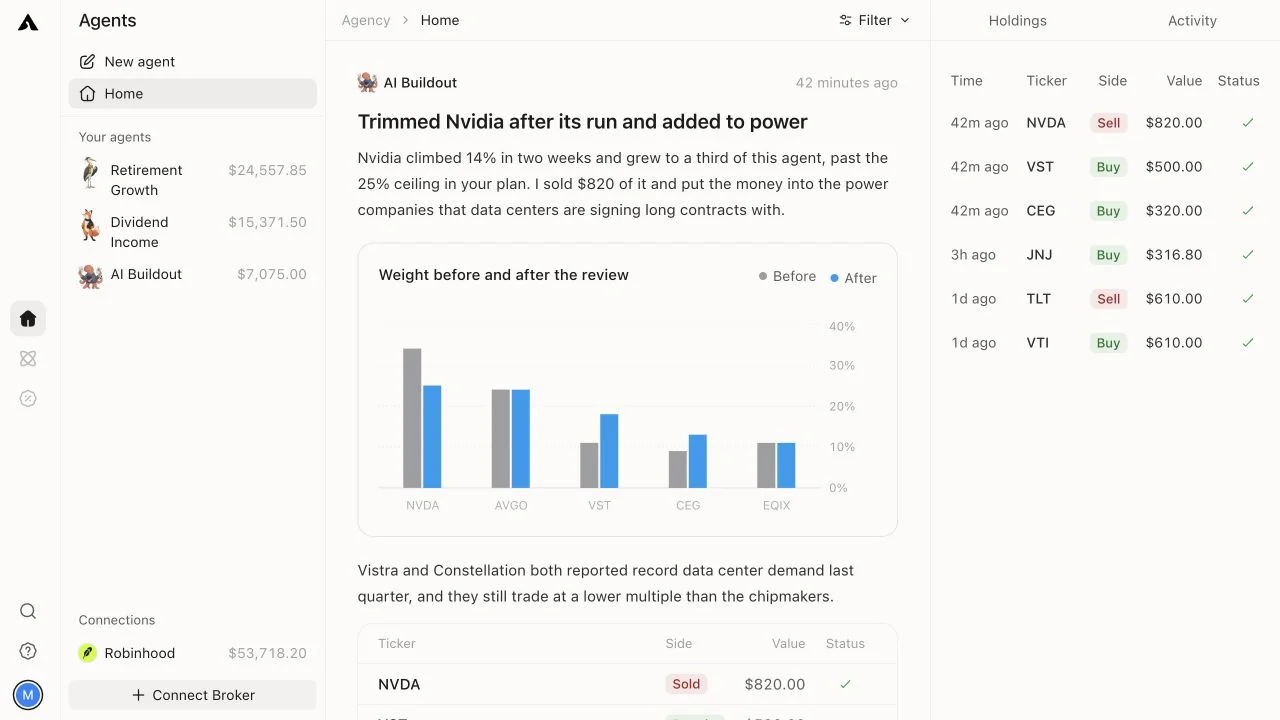
Agency’s first look is a proposal, not a verified return history. Use its notes to inspect decisions and your broker’s records to reconcile trades. Start with paper trading if you need to evaluate execution without live capital.